Visualise your Big Data to save time and money!
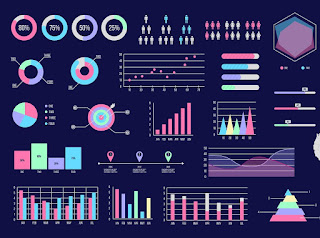
Big Data Visualisation for small Irish businesses is something that can help us save both time and money! The goal of big data visualisation is to visually comminucate data-sets in a clear and effective way, [1] usually by way of an infographic, a chart, a map or some other sort of diagram. The idea is that we can easier present big amounts of data in the form of a visual representation than with raw figures. This could help when presenting results at a meeting, reassuring investors about our success or telling potential customers about the benefits of our products! Although colleges like Dublin Business School and IADT offer data analytics and data visualisation courses, a lot of the basics can be learned from Google Data Studio , Google's free service that links to your Google Analytics account. Knowing which types [2] of visualisations to use for which sorts of big data sets can be important in ensuring that we present the information in a clear...