Visualise your Big Data to save time and money!
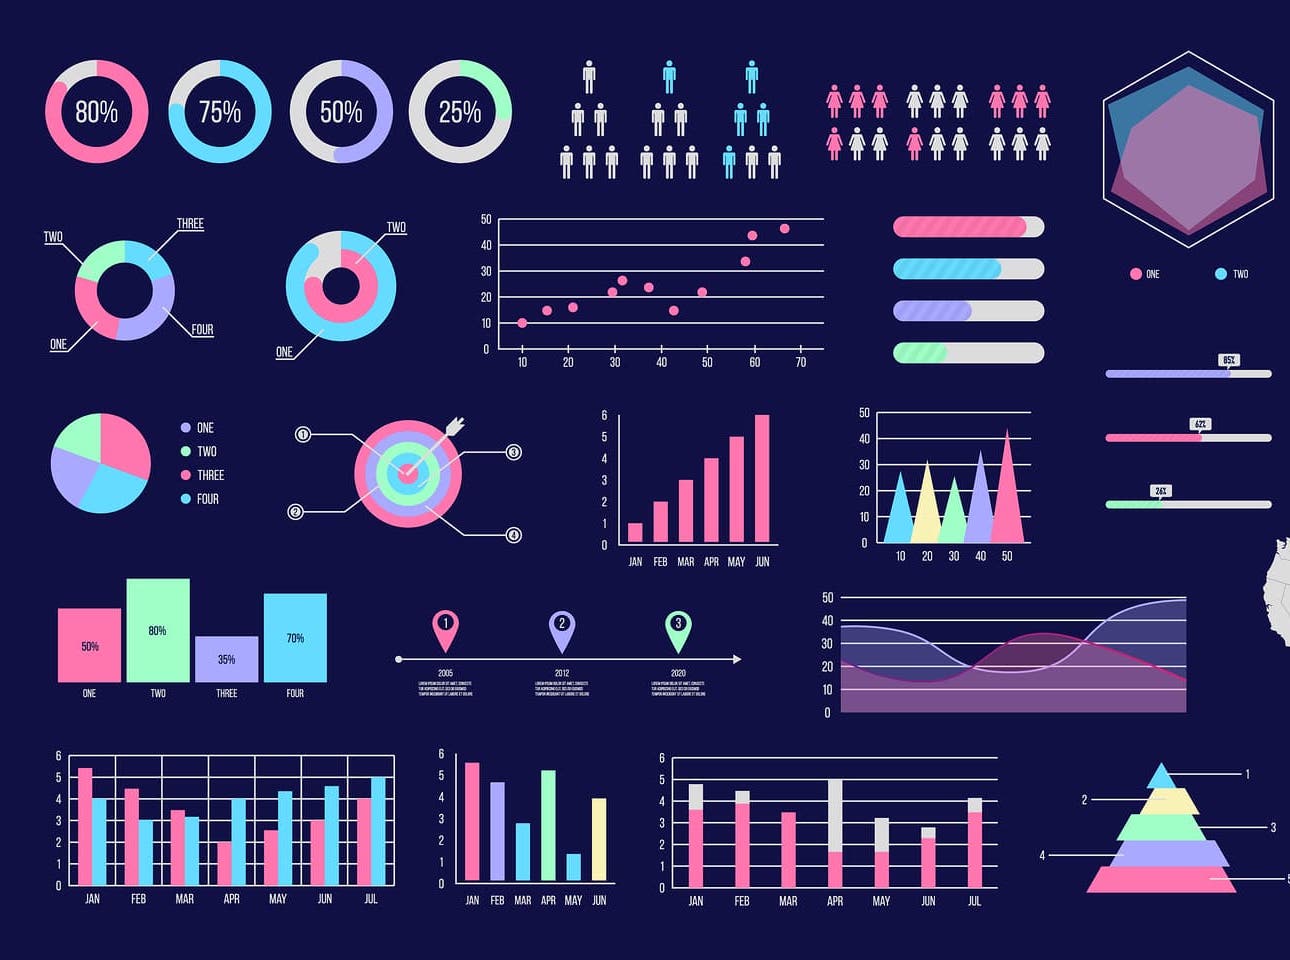
The goal of big data visualisation is to visually comminucate data-sets in a clear and effective way,[1] usually by way of an infographic, a chart, a map or some other sort of diagram. The idea is that we can easier present big amounts of data in the form of a visual representation than with raw figures. This could help when presenting results at a meeting, reassuring investors about our success or telling potential customers about the benefits of our products!
Although colleges like Dublin Business School and IADT offer data analytics and data visualisation courses, a lot of the basics can be learned from Google Data Studio, Google's free service that links to your Google Analytics account.
Knowing which types[2] of visualisations to use for which sorts of big data sets can be important in ensuring that we present the information in a clear way! Let's discuss some of the main types of data visualisation:
The first main type of big data visualisation is Temporal. This refers to any data visualisation that can be plotted on one dimension, or in a linear fashion. Think timelines, line-graphs or scatter plots!
The second main type of big data visualisation is Network. This refers to any data visualisation where a data set is connected to other data sets. The Network visualisation will show how the relationships between data sets within their networks. Some examples of these are Matrix charts, Word clouds and node-linked diagrams.
The third main type of big data visualisation is Heirarchical. This refers to any data visualisation where a it's necessary to order a group (or groups) within a larger group. Heirarchical visualisations can be used when displaying information clusters, particulary those originating from a specific point of origin. Some examples of these are Ring charts and tree diagrams.
The fourth main type of big data visualisation we're going to talk about is Geospatial. This refers to any data visualisation where a real-life location is relevant to the data on display, usually in the form of data sets overlayed on a map. We could use these to display sales over time in a certain region. Common examples of Geospatial visualisation are Flow maps and Heat maps.
The last main type of big data visualisation we'll talk about today is Multidimensional. We use these whenever we have 2 or more variables, leading to the creation of a 3D data visualisation. Common examples of Multidimensional visualisation are Scatter plots, pie charts and histograms.
When choosing which of these types of data visualisations to use, ask yourself the following:
- What is the relationship we're trying to determine between our data sets?
- Are we trying to find the distribution of our data and look for outliers or anomalies?
- Are we trying to compare multiple values or trying to analyse a single value over time?
- Are we trying to analyse any potential trends in our data sets?
So think about how you could use some of these types of data visualisation today!
[1] Tableau. 2021. Data visualization beginner's guide: a definition, examples, and learning resources. [online] Available at: <https://www.tableau.com/learn/articles/data-visualization> [Accessed 11 April 2021].
[2] Klipfolio.com. 2021. What is Data Visualization? Definitions, Graph Types and How to Use Them. [online] Available at: <https://www.klipfolio.com/resources/articles/what-is-data-visualization> [Accessed 11 April 2021].


When coming to save time and improve decision-making, every help is welcome, especially for SMEs. Data visualization can help companies of all sizes make informed decisions to drive their growth, profitability and gain a competitive advantage. Despite the benefits, SMEs are often hesitant to use Visualization tools solutions due to the fear of cost escalations and having assumptions that they are too troublesome or too advanced to be cost-effective for a business of their size. The key here is to understand which data will meet specific business goals. For many SME’s Google Data Studio seems to be a great start. It is free cost, easy to use, cloud-based, and completely managed, with tight integration with Google’s Ecosystem.
ReplyDelete